FTB Debug Tool
The FTB Debug Tool (otherwise known as FTB-DBG) is a tool created by FTB to provide our team as much information about the environment the app is running in and any issues that may have present during runtime.
No sensitive information is ever shared using this tool!
In this guide, we'll show you the basics of running the debug tool and how to provide the right information to our team to support you.
If you do not have an issue. You do not need to use this guide.
Downloading
You can find the download links for each operating system we support. We've included ARM versions for each system but unless you know you're running an ARM machine, you'll likely want the Intel / AMD 64 versions.
| Operating System | Architecture | Link |
|---|---|---|
| Windows | Intel / AMD | Download (Recommended) |
| Windows | Arm | Download |
| MacOS | Intel / AMD | Download (Recommended) |
| MacOS | Apple Silicon / ARM | Download |
| Linux | Intel / AMD | Download (Recommended) |
| Linux | Arm | Download |
Using
Using the FTB Debug Tool is typically as simple as double-clicking the .exe file that you downloaded from above. In some cases it's a bit more complicated so we've outlined what you need to do for Linux & MacOS below.
Once you've downloaded the tool, you'll want to run it.
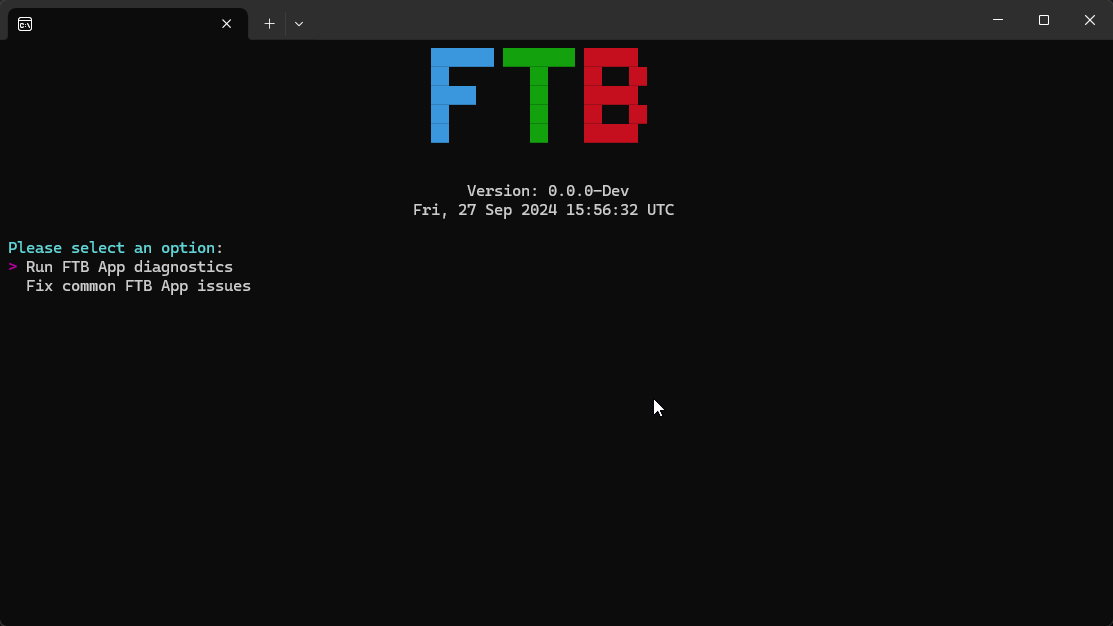
When the debug tool opens you will be shown a screen like this where you have 2 options.

-
Option 1 "Run FTB App diagnostics", will run a diagnostics test on the files the app stores on your computer and provides a support code for the support team to use.
-
Option 2 "Fix common FTB App issues", will run though some common fixes for the app, we recommend only running this if you have been asked to by a support team member.
You can swap between the options by using the arrow keys on your keyboard and pressing enter to select the option.
Running diagnostics
To run the diagnostics, you'll want to select the first option by pressing enter once the tool has opened. This will then run the diagnostics and provide you with a code to provide to the support team member that has requested it.
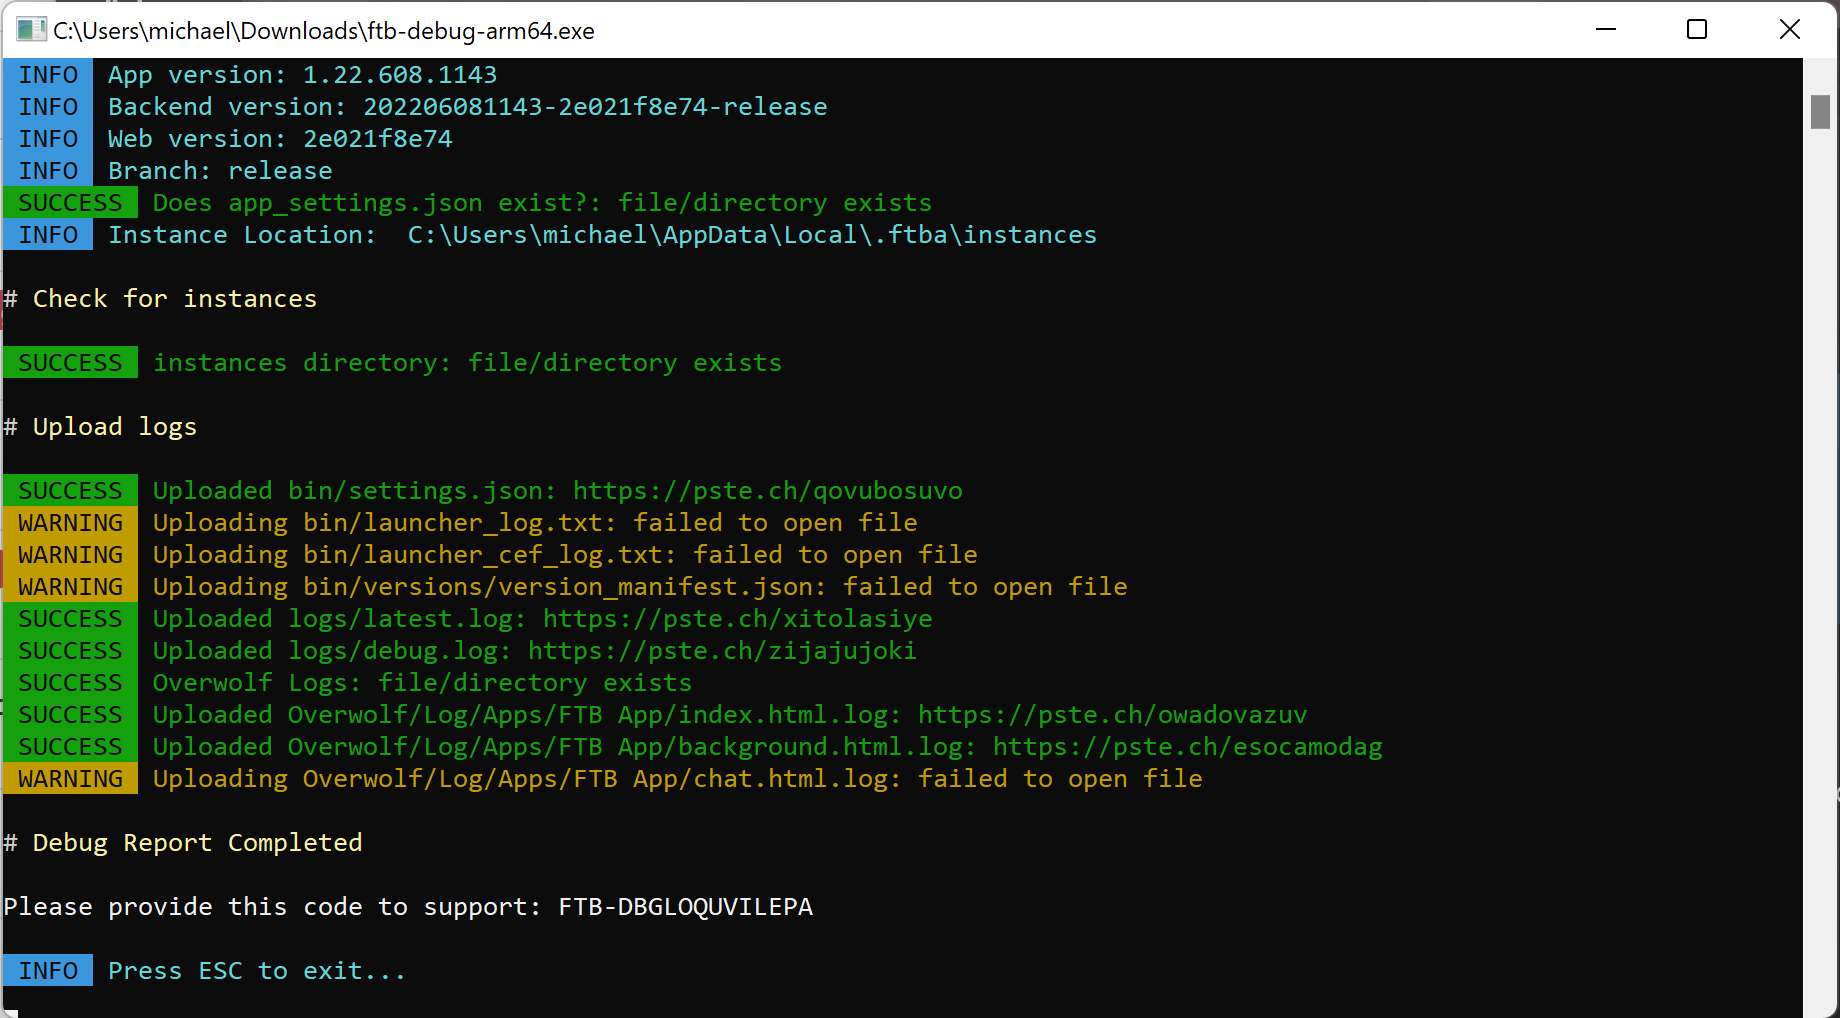
A successful run will look like this

You can see that after the application has run, you are given a code, in this example the code is dbg:YBJTSjo26pw. Copy this code and provide it to the support team member that has requested it from you.
If something has gone wrong, see our troubleshooting guide below.
Using on MacOS & Linux
Using the debug tool on MacOS and Linux is a little more involved but is still relatively simple. You can follow this simple step by step guide to see how to run the tool.
- Download the tool (Download)
- Open the
Terminal(Linux users, open your distro's variant of the terminal) - Run
cd {location of the debug tool}typically this will be the downloads' folder. A real example of this would becd /home/mikey/Downloads/ - Run the follow command
chmod +x ftb-debug-darwin-amd64(chmod +x ftb-debug-linux-amd64for linux operating systems). Replace-amd64with-arm64 or -armrespectively for ARM systems - This step is optional as most systems will now let you double-click the file. If this is not the case. Simple run the same command as above but replace
chmod +xwith./. An example of this would be./ftb-debug-linux-amd64. - Provide the code to the support member that asked for the code
- Profit!
# Example of the full flow
cd /home/mikey/Downloads
chmod +x ftb-debug-linux-amd64
./ftb-debug-linux
Troubleshooting
Windows may sometime block the running of the application. Make sure you've allowed it past your anti-virus & windows defender.
This will happen when you've download the wrong file for your operating system. Remember that most operating systems are Intel/AMD based so that is likely the right file for you.